
LONI Visualization Tool
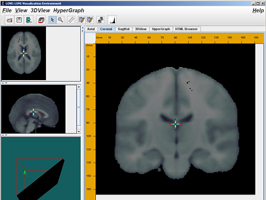
An interactive tool for stereotaxic brain data visualization. LOVE is a 3-D viewer that allows volumetric data display and manipulation of axial, sagittal and coronal views.
Features
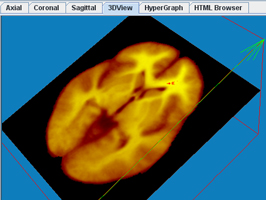
- LONI Viz includes a SurfaceViewer and a full real-time Volume Renderer. These allow the user to view the relative positions of different anatomical or functional regions, which are not co-planar in any of the axial, sagittal or coronal 2D projection planes.
- LONI Viz features a region drawing module used for manual delineation of regions of interest. A series of 2D contours describing the boundary of a region in projection planes (axial, sagittal or coronal) can be used to reconstruct the surface-representation of the 3D outer shell of the region.
- A 3D shell can be resliced in directions complementary to the drawing direction, and these complementary contours can be loaded in all tree cardinal views. In addition the surface object can be displayed using the SurfaceViewer.
- Brainmapper provides the real interaction between the anatomical (voxel/world) atlas coordinates, the brain-tree (region hierarchical labeling nomenclature), the region description data-base and the moleculo-genetic database allowing the user to synchronously query these sources of information and continuously map results between these different entities.
- LONI Viz permits the user to overlay several pre-registered volumes, change intensity colors and ranges and the inter-volume opacities to visually inspect similarities and differences between the different subjects/modalities.
- The software is available as both an applet and a standalone application. The applet can be used to browse data from within the LONI database, but it does have restrictions on file-size, Internet connection and network-bandwidth and client/server file access. The application requires a local install and configuration of the LONI_Viz software.
Description
LONI_Viz, is a 3-D viewer that allows volumetric data display and manipulation of axial, sagittal and coronal views. It is a portable Java-based software, which only requires a Java interpreter and a 64 MB of RAM memory to run on any computer architecture.System Requirements
Java
- Version: v.5.3 without data
- Size: 15.8 Mb
- OS: Windows 98/2000/XP and Unix/Linux
- Processor: 600 MHz Pentium chip or better
- Memory: 128 Mb
- Software: Java 2 (Runtime or SDK) version 1.3.1 or later, Java 3D(TM) version 1.3.1
Java
- Version: 04-06-06 release
- Size: 48.93 Mb
- OS: any
- Processor: any
- Memory: 128 Mb
- Software: Java 2 (Runtime or SDK) version 1.3.1 or later, Java 3D(TM) version 1.3.1
Java
- Version: v.5.3 with data
- Size: 51.65 Mb
- OS: Windows 98/2000/XP and Unix/Linux
- Processor: 600 MHz Pentium chip or better
- Memory: 128 Mb
- Software: Java 2 (Runtime or SDK) version 1.3.1 or later, Java 3D(TM) version 1.3.1
Installation
Installatioin
Unzip the zip file into a LOVE_dir folder. In windows, LOVE does not update your registry, so if you want to uninstall it, just delete all the directories and files that correspond to LOVE. Follow the same procedure for unix/linux.
Purpose
LONI_Viz is a versatile 1D, 2D and 3D data viewer geared for cross-platform visualization of stereotactic brain data. It reads Analyze, Raw-binary and NetCDF volumetric data, as well as, Multi-Contour Files (MCF), LWO/LWS/DXF surfaces, and atlas hierarchical brain-region labelings (Hyperbolic BrainGraph Model Display).
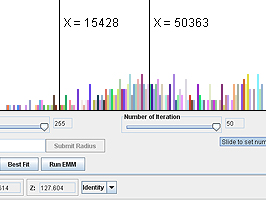
LONI_Viz allows the user to interactively overlay and browse through several data volumes, zoom in and out in the axial, sagittal and coronal views, and reports the intensities and the stereo-tactic voxel and world coordinates of the data.
Expert users can use LONI_Viz to delineate structures of interest, e.g., sulcal curves, on the 3 cardinal projections of the data. These curves then may be use to reconstruct surfaces representing the topological boundaries of cortical and sub-cortical regions of interest.
View the UML diagram.